Troubleshooting and scaling
Troubleshooting and scaling your cluster requires lots of investigation and understanding of your workload and cluster behaviour. Here's what you should care about:
- Buffers
- Cache (both filling, hit & miss, and eviction)
- CPU use and load average
- OOM errors
CPU
If you're CPU bound, there's a few things you need to pay attention to:
- CPU consumption: > 90% you'll get into trouble. Your data node need to perform frequent administrative tasks such as getting the cluster state, sending information to the master or merging.
- Load average: a high load average might imply an IO issue, a context switching problem, some nasty Java or kernel bugs…
- The state of your thread pools, especially the state of rejected threads. And raising the queue size is never the right solution on the long term.
- The number of search / writes per second
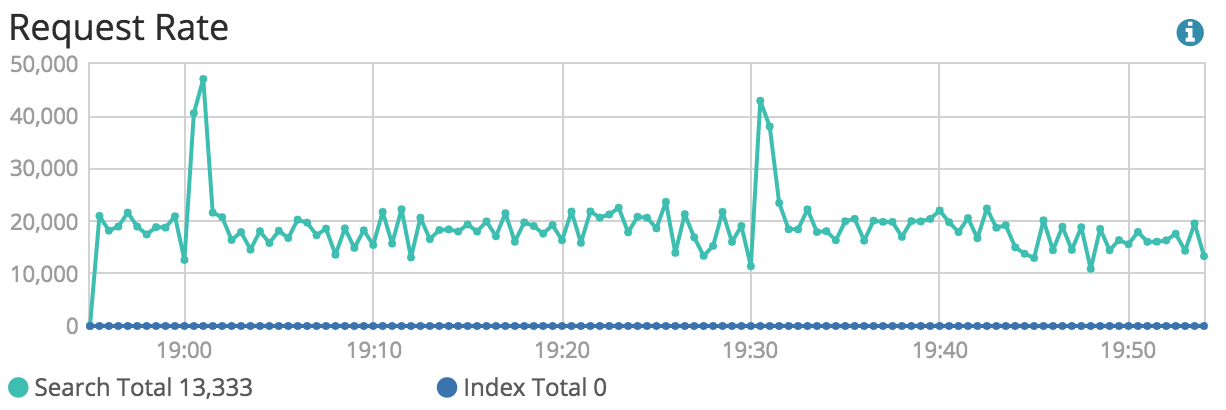
- The average time taken by your queries
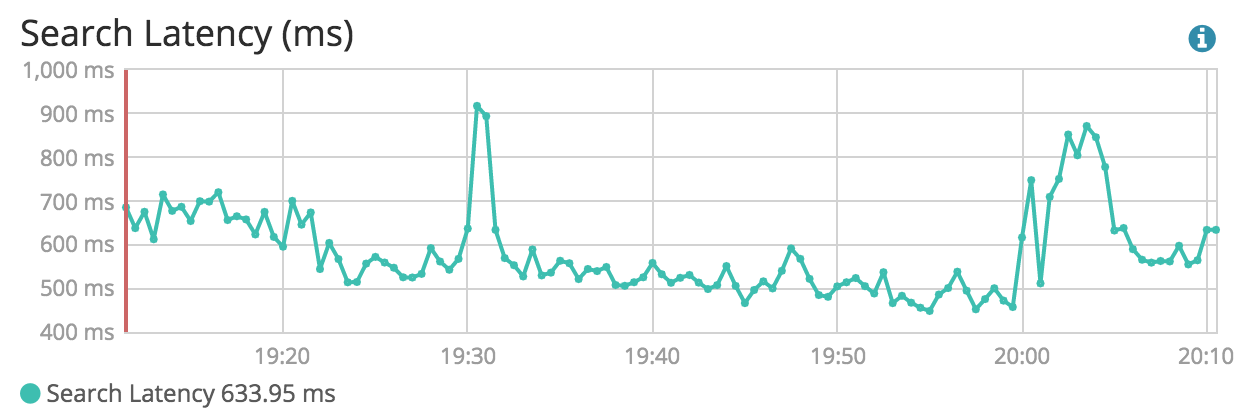
A good way to know which queries take the more time is by using Elasticsearch slow queries logs.
PUT /index/_settings
{

    "index.search.slowlog.threshold.query.warn: 1s",
    "index.search.slowlog.threshold.query.info: 500ms",
    "index.search.slowlog.threshold.query.debug: 1500ms",
    "index.search.slowlog.threshold.query.trace: 300ms",
    "index.search.slowlog.threshold.fetch.warn: 500ms",
    "index.search.slowlog.threshold.fetch.info: 400ms",
    "index.search.slowlog.threshold.fetch.debug: 300ms",
    "index.search.slowlog.threshold.fetch.trace: 200ms"
}
If you can't optimize your queries, then you'll have to add more resources or rewrite everything to better use Elasticsearch, or something else.
Memory
Memory management issues used to be my worst nightmare. Thankfully it's not anymore. There are many tools to investigate the content of Elasticsearch memory, either in real time or after a crash. My favourite isYourkit Java Profiler, which has a free trial version.
If you experience multiple memory related crashes, make sure Elasticsearch dumps its memory when crashing. If you allocate 31GB to the heap you'll get 31GB dumps, so expand your filesystem accordingly, and activate memory dumps.
-XX:+HeapDumpOnOutOfMemoryError -XX:HeapDumpPath=/srv/elasticsearch/heapdump.hprof